Predicting Fraudulent Clicks in Mobile App Advertising: A Machine Learning Journey
Introduction
During my 4th semester course on Imbalanced Data, I tackled a fascinating real-world problem: detecting fraudulent clicks in mobile app advertising. This project was inspired by a Kaggle competition originally hosted by TalkingData, China’s largest independent big data service platform.
The Problem: Click Fraud in Mobile Advertising
In the vast landscape of digital advertising, click fraud poses a significant challenge. With China’s mobile market exceeding 1 billion active devices monthly, the scale of potential fraud is enormous. TalkingData, which handles approximately 3 billion clicks daily, estimates that 90% of these clicks could be fraudulent.
This isn’t just a numbers game - fraudulent clicks directly impact businesses’ bottom lines. When advertisers pay per click, fraudulent activities can quickly drain advertising budgets without generating genuine user interest or app installations.
Dataset and Challenge
The project utilized a dataset of approximately 30 million clicks collected over four days. Each record contained various features including:
- IP addresses
- App IDs
- Device types
- Operating systems
- Channels
- Timestamps
- Whether the click led to an app download (our target variable)
Data Analysis and Insights
Class Imbalance Challenge
One of the first significant challenges I encountered was the severe class imbalance in the dataset:
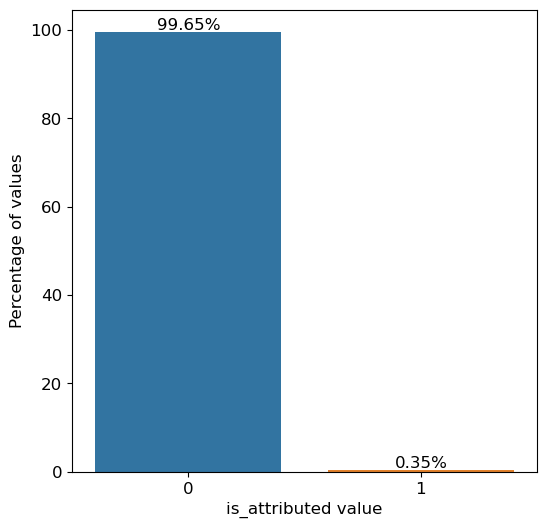
The visualization clearly shows the extreme imbalance in our dataset - only 0.35% of clicks led to actual app installations. This severe imbalance would make it difficult for a model to learn patterns in the minority class (legitimate installations).
To address this, I implemented Random Undersampling using scikit-learn’s RandomUnderSampler. This technique randomly removes samples from the majority class (non-installations) until the dataset reaches a more balanced distribution. While this reduces the total amount of training data, it helps prevent the model from being overwhelmed by the majority class and allows it to learn meaningful patterns from both classes.
Temporal Patterns
Analysis of click patterns across different hours revealed interesting insights:
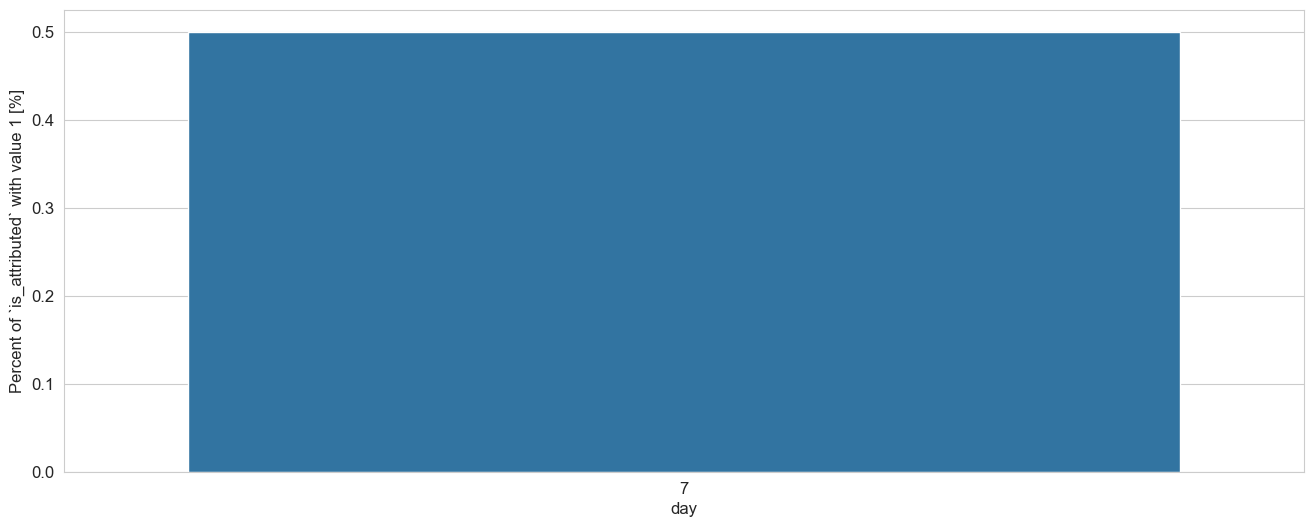
The hourly distribution shows clear patterns in click behavior throughout the day. Some hours show significantly higher rates of legitimate installations, while others show suspicious patterns that might indicate fraudulent activity. This temporal analysis proved crucial for feature engineering.
Channel and Feature Analysis
Examining the relationship between different channels and conversion rates provided valuable insights:
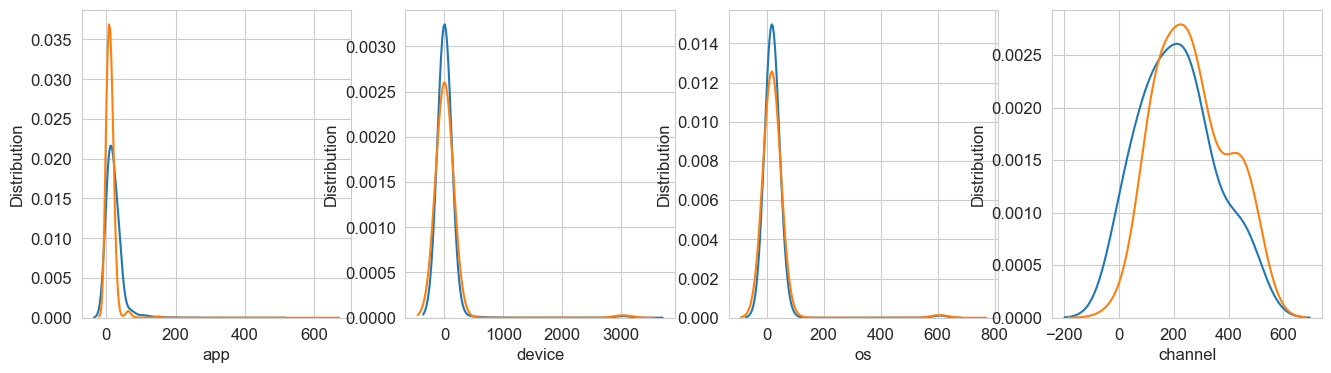
The density plots show the distribution of various features including app, device, OS, and channel numbers between fraudulent and legitimate clicks. The distinct patterns in these distributions helped inform our feature engineering process.
Model Development
Handling Imbalanced Data
To address the severe class imbalance, I implemented the following strategy:
- Applied Random Undersampling to balance the classes
- Carefully monitored validation metrics suitable for imbalanced data
- Used stratification in data splits to maintain class distribution
Feature Engineering
I engineered several sophisticated features to capture complex patterns:
-
Time-based features:
- Hour and day extraction
- Click patterns within specific time windows
- Variance in click timing per IP
-
Aggregation features:
- Click counts per IP/app combination
- Unique app counts per IP
- Channel diversity per IP
- Device-OS combinations
- IP-based statistics
LightGBM Implementation
I chose LightGBM as the primary model for several reasons:
- Gradient boosting framework that specializes in large-scale data
- Efficient handling of categorical features through its unique feature bundling
- Leaf-wise tree growth strategy that’s particularly effective for imbalanced datasets
- Support for custom evaluation metrics
The model was configured with carefully tuned parameters:
- Learning rate: 0.1
- Maximum depth: 10
- Number of leaves: 90
- Minimum child samples: 100
- Subsample ratio: 0.9
- Column subsample ratio: 0.7
Results and Evaluation
Model Performance
The final model achieved the following metrics:
- ROC AUC Score: 0.774
- Optimal Threshold: 0.982
- Best F1 Score: 0.534
Confusion Matrix
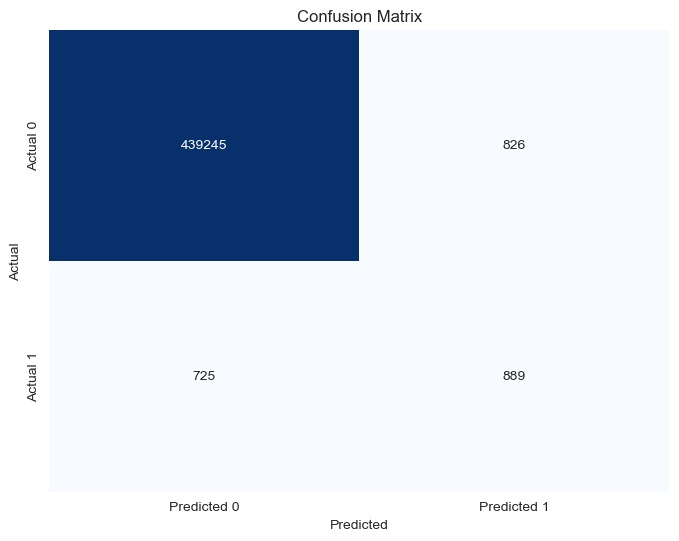
The confusion matrix provides a detailed view of our model’s performance across different prediction categories, showing how well it identifies both fraudulent and legitimate clicks.
Challenges and Learnings
- Data Scale: Handling 30 million records required efficient data processing techniques and careful memory management.
- Feature Engineering: Creating meaningful features from raw click data was crucial for model performance, particularly the temporal and IP-based features.
- Class Imbalance: The extreme imbalance (0.35% positive cases) required careful consideration of sampling techniques and evaluation metrics.
- Model Selection: LightGBM proved particularly effective due to its ability to handle both large-scale and imbalanced data efficiently.
Future Improvements
Several areas could be explored to enhance the model:
- Implementing real-time prediction capabilities
- Incorporating additional data sources
- Exploring deep learning approaches
- Developing an ensemble of multiple models
Conclusion
This project was an excellent opportunity to work with imbalanced data in a real-world context. It demonstrated how machine learning can be applied to solve significant business problems, particularly in the digital advertising space.
The experience taught me valuable lessons about handling large-scale data, dealing with class imbalance, and the importance of thorough feature engineering. Most importantly, it showed how technical solutions can directly impact business outcomes by preventing fraudulent activities and optimizing advertising spend.