Weather Station with ML capabilities
In my 4th semester, I joined JoEL (Joy of Engineering Lab) with my friend Thithikshaa, and together, we set out to build a weather station integrated with machine learning. The idea was simple: create a system that could gather real-time weather data and predict future temperatures, specifically focusing on remote areas where weather monitoring is limited to basic sensors and less reliable data. We presented our project at the JoEL Roadshow 2024, and it was well-received as an example of practical engineering combined with data analytics.
This blog will go through the various components of the weather station, how it works, and how it utilizes machine learning for weather prediction.
Concept and Motivation
The motivation for this project was to help monitor weather conditions in remote places where only basic sensors are available, and where data from larger weather stations might not be accurate or current. The project integrates IoT for data collection, a web-based dashboard for data visualization, and machine learning to predict temperature changes based on historical data.
Components and Setup
Hardware
The hardware setup for this weather station consists of:
- ESP8266 NodeMCU: A microcontroller with built-in Wi-Fi for data acquisition and server hosting.
- DHT11 Sensor: Measures temperature and humidity.
- BMP280 Sensor: Captures atmospheric pressure.
- Rain Sensor: Detects rainfall.
The NodeMCU collects data from these sensors and serves it to the backend for visualization and analysis. Below is an image of the assembled hardware:
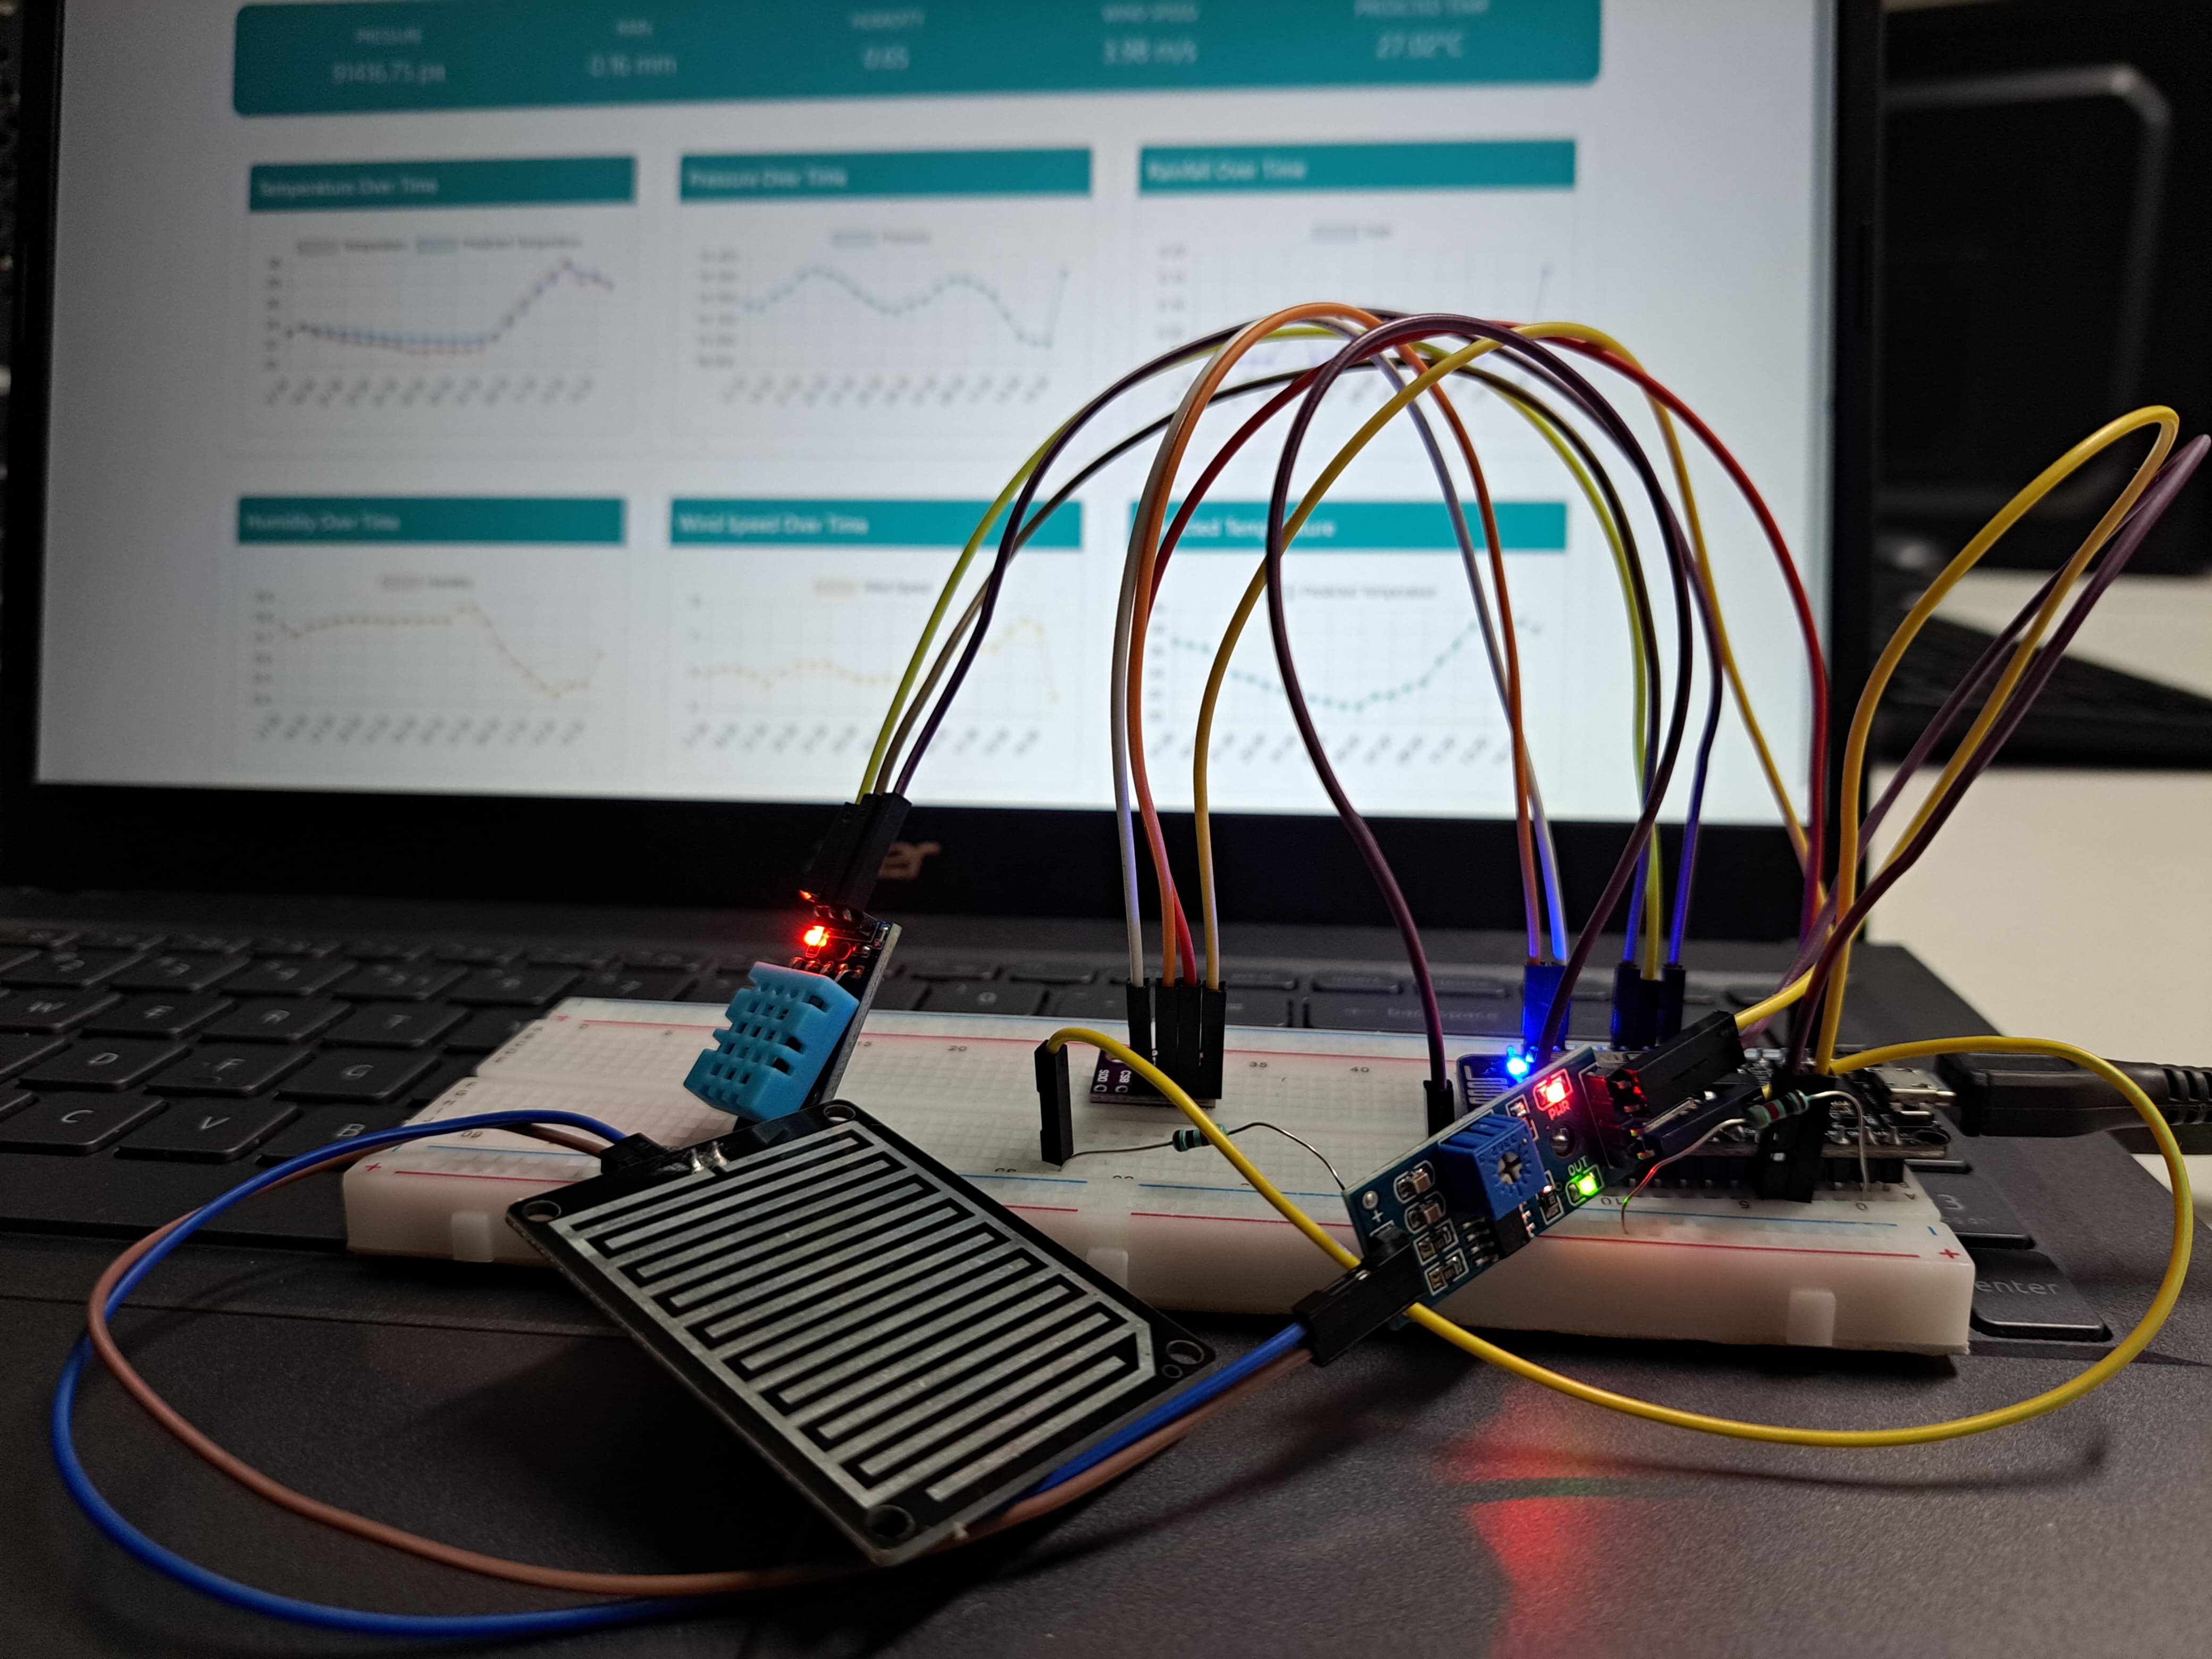
The weather station setup using NodeMCU and sensors.
Circuit Diagram
Here’s a schematic representation of the circuit connections:
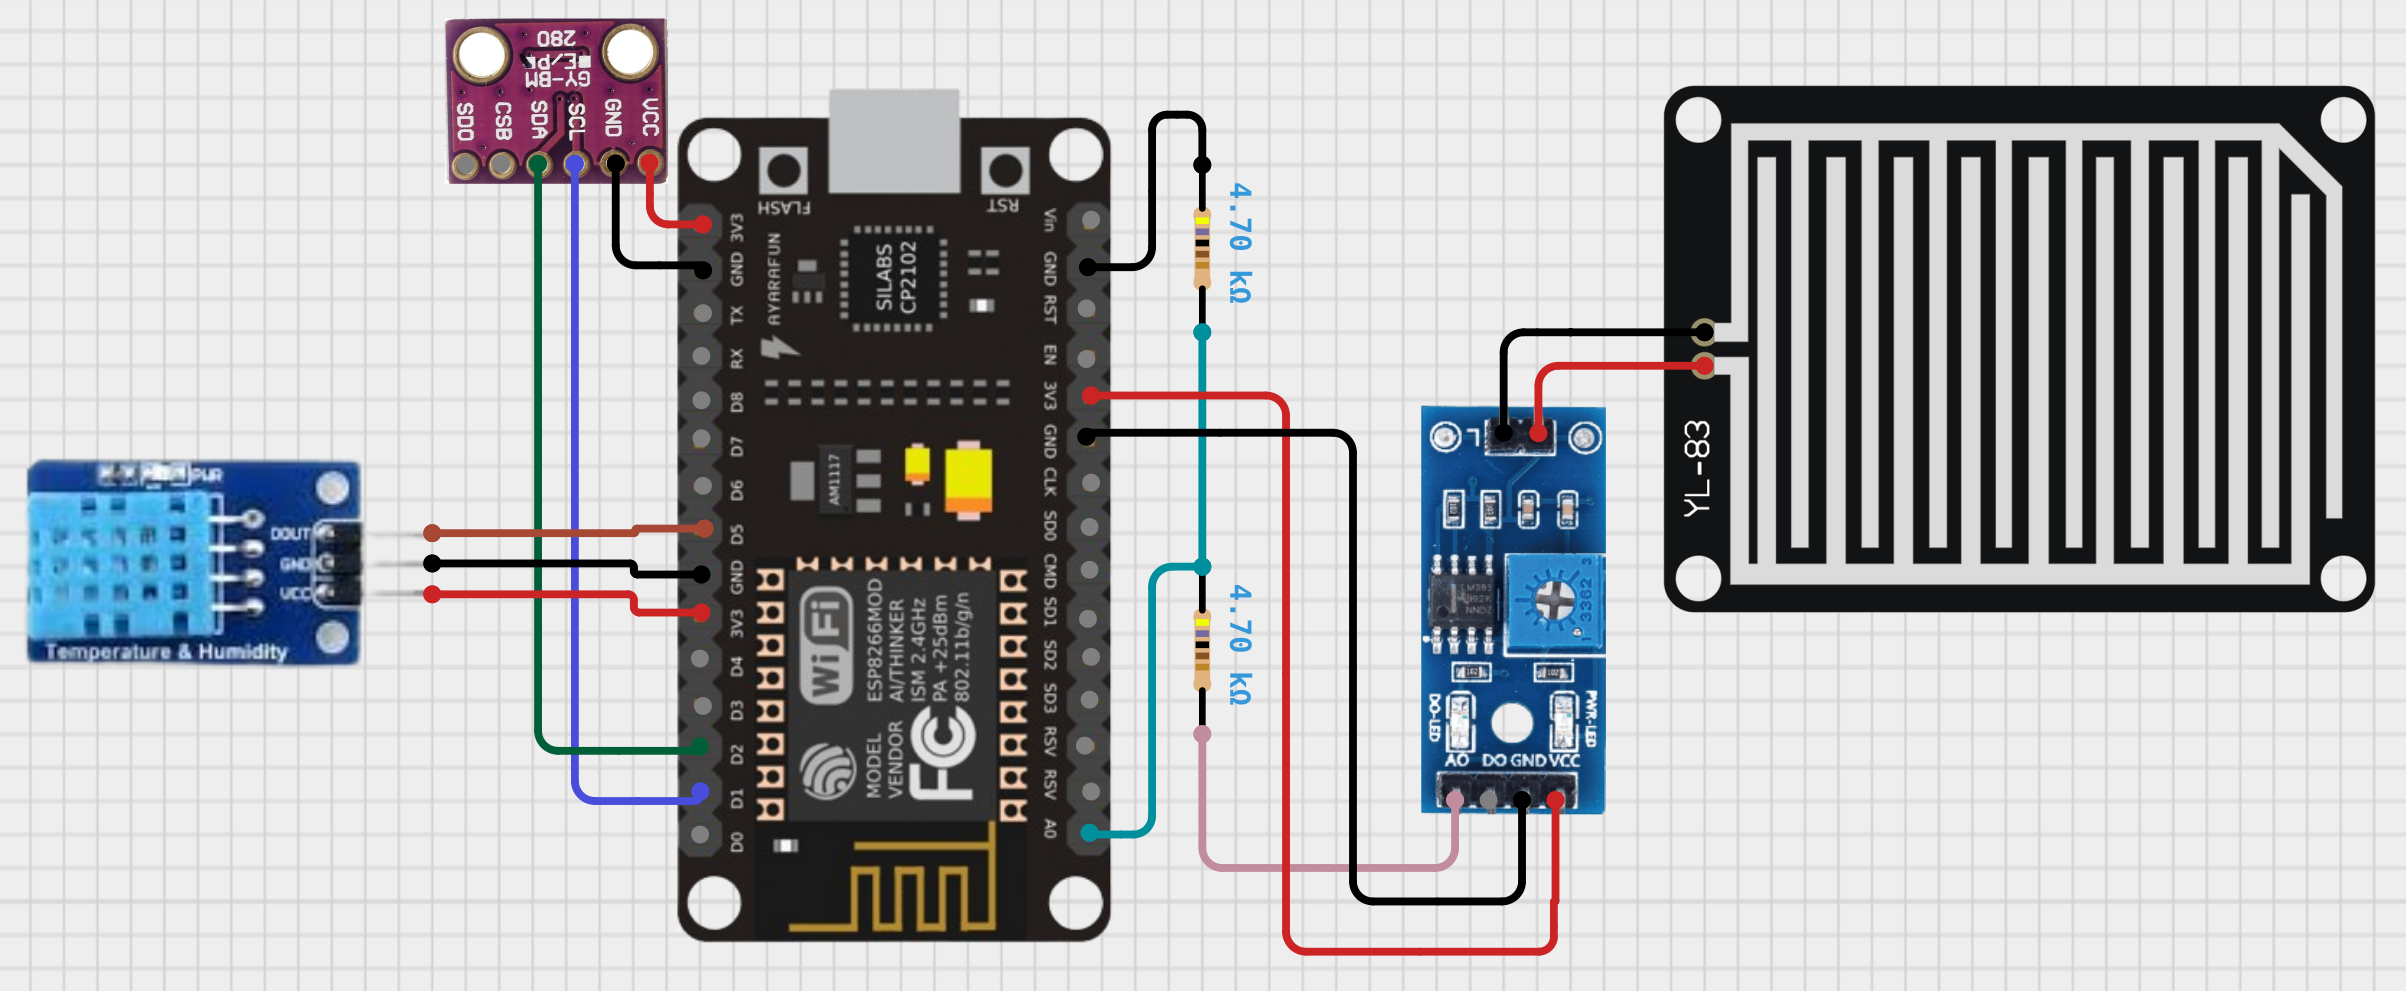
The schematic showcasing the connections between ESP8266, BMP280, DHT11, and other components.
Data Collection and Processing
Data collection is done using the ESP8266 NodeMCU, which collects real-time temperature, humidity, atmospheric pressure, and rainfall data. This data is periodically sent to the backend using HTTP requests.
In the main.py script, data from a CSV file (bangalore.csv) is used to handle the real-time and historical data processing. The function below reads data and is used for prediction:
import pandas as pd

def read_weather_csv():
    return pd.read_csv('bangalore.csv', parse_dates=['datetime_utc'], index_col='datetime_utc', dayfirst=True)

def predict_temperature():
    weather_df = read_weather_csv()
    weather_df_num = weather_df.loc[:, ['temperature_C', 'relative_humidity', 'wind_speed_mps', 'total_precipitation_mm', 'surface_pressure_pa']].dropna()

    regr = RandomForestRegressor(max_depth=90, random_state=0, n_estimators=100)
    regr.fit(weather_df_num, weather_df_num.pop("temperature_C"))

    hourly_prediction = regr.predict(weather_df_num.iloc[-24:])
    return hourly_prediction.tolist()
Dashboard for Data Visualization
The data collected by the weather station is visualized through an interactive web dashboard built with HTML, CSS, JavaScript, and Chart.js. This dashboard provides real-time updates, allowing users to view trends in temperature, pressure, rainfall, and humidity. Here is a snapshot of the dashboard:
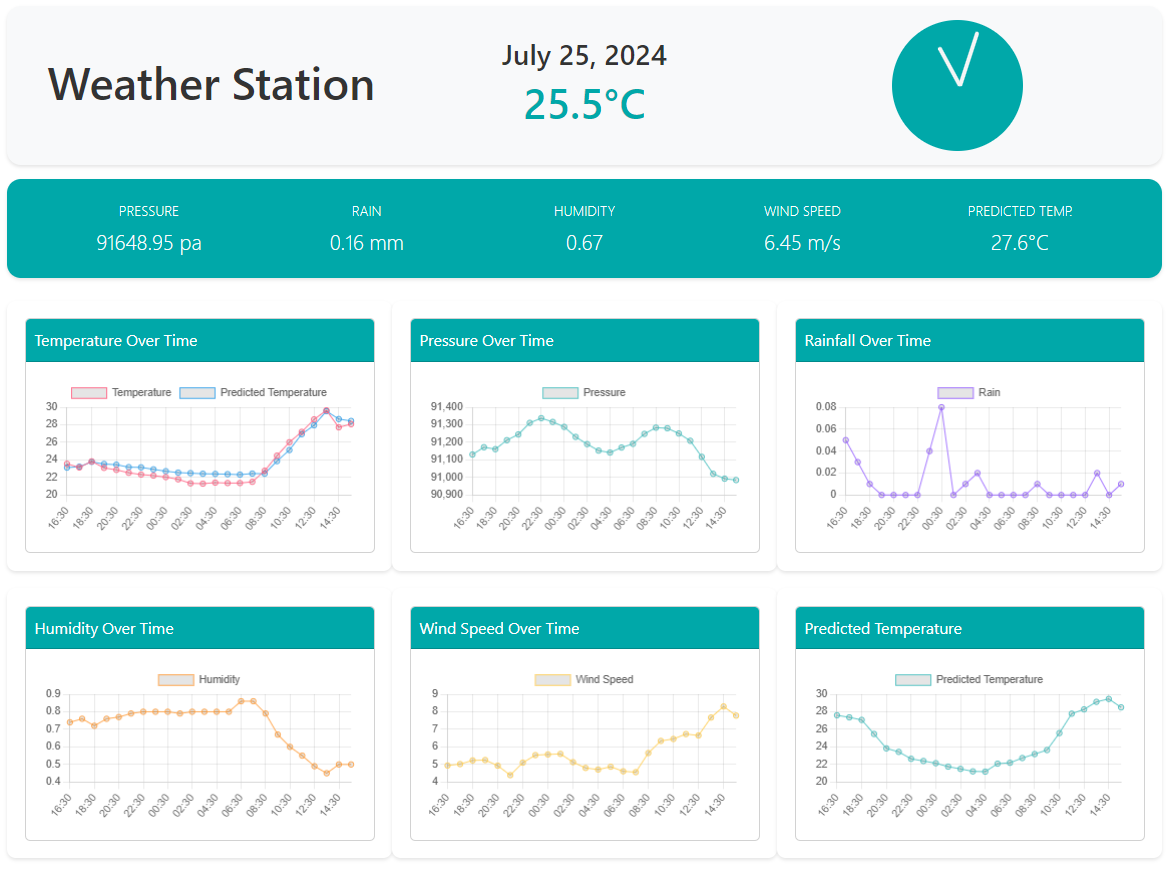
Dashboard showing real-time weather conditions and trends.
This visualization is particularly helpful for understanding how various weather parameters change over time and for observing potential patterns.
Machine Learning for Prediction
For predicting future temperatures, a Random Forest Regressor model was used. The model was trained using historical data from the last seven years, obtained from multiple sources, and the current weather data gathered by our sensors.
The model, optimized through hyperparameter tuning, demonstrated outstanding predictive capabilities, achieving a Mean Squared Error (MSE) of 0.136, a Mean Absolute Error (MAE) of 0.269, an R² Score of 0.990, and an Explained Variance Score of 0.990.
In the train.py script, historical data is preprocessed, and features such as lag values for temperature, cyclic features for time, and normalization are generated. Here’s a part of the training process:
import pandas as pd
from sklearn.ensemble import RandomForestRegressor
from sklearn.preprocessing import StandardScaler
import joblib

# Load the data and perform preprocessing
data = pd.read_csv('bangalore.csv')
data['datetime_utc'] = pd.to_datetime(data['datetime_utc'], format='%d-%m-%Y %H:%M')

# Adding lag features to capture temperature trends over time
for lag in range(1, 25):
    data[f'temperature_lag_{lag}'] = data['temperature_C'].shift(lag)

data = data.dropna()

# Splitting and scaling data
X = data.drop(['temperature_C', 'datetime_utc'], axis=1)
y = data['temperature_C']

scaler = StandardScaler()
X_scaled = scaler.fit_transform(X)

# Training the Random Forest Regressor
best_rf_model = RandomForestRegressor(max_depth=20, n_estimators=300, random_state=42)
best_rf_model.fit(X_scaled, y)

# Save the trained model and scaler
joblib.dump(best_rf_model, 'best_rf_model.pkl')
joblib.dump(scaler, 'scaler.pkl')
Model Results
The trained Random Forest model was used to predict temperature changes over time. The predicted values are compared with the actual values in the graph below:
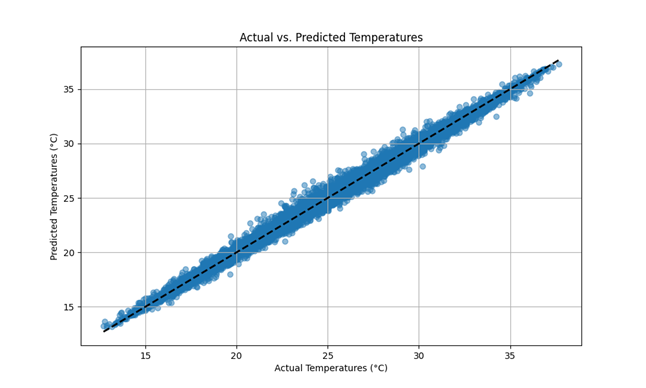
Graph comparing actual and predicted temperatures, demonstrating the accuracy of the model.
Additionally, the prediction errors are visualized here:
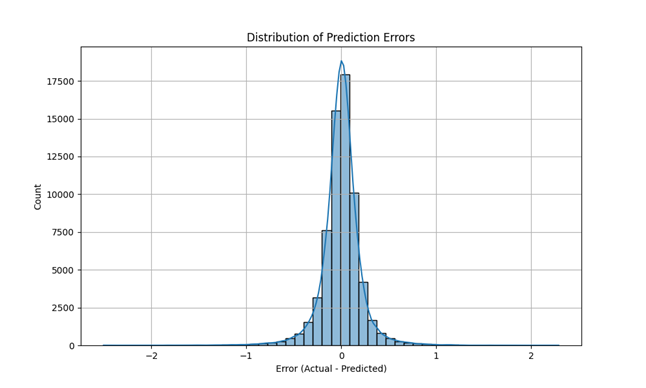
Graph showcasing the prediction errors, showing the deviation between actual and predicted values.
Motivation and Utility
The utility of this project lies in its ability to predict temperature in areas where accurate weather data might not be available. The model helps fill in gaps by providing temperature predictions based on local sensor data, thus enhancing the reliability of weather information for planning and decision-making purposes.
The goal was to use minimal hardware and locally collected data to provide an accurate and insightful weather overview. The integration of IoT-based hardware with machine learning allows for a seamless flow of data—from collection to prediction—all presented through a user-friendly interface.
Presentation at JoEL Roadshow 2024
The culmination of our work was presenting this project at the JoEL Roadshow 2024. The combination of simple hardware and advanced data analytics effectively showcased how engineering could solve practical problems in remote monitoring.
Conclusion
This weather station project illustrates how a simple setup of sensors and an ESP8266 NodeMCU, when paired with a machine learning model, can provide valuable weather data and predictions. The project aims to offer an affordable solution for remote weather monitoring and help improve data accuracy for users in underserved areas.
If you’re interested in exploring this idea further or wish to replicate it, the hardware requirements are minimal, and the project provides a useful way to apply machine learning in a practical context. It has been an educational journey, and we hope it inspires others to experiment with IoT and data analytics as well.